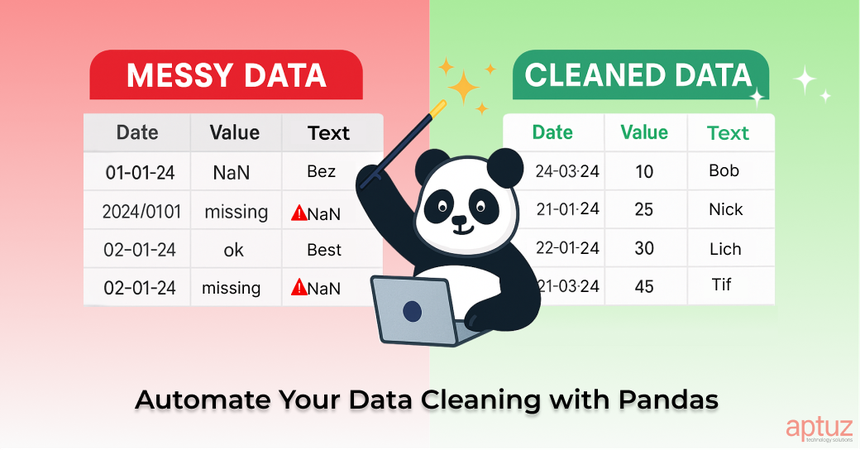
If you’ve ever opened a raw CSV file, you know the struggle! Missing values, inconsistent formats, duplicate entries, and columns that just don’t make sense. It’s something that anyone who deals with data has experienced. Whether you're a data scientist, analyst, or developer, messy data is often the biggest bottleneck between collecting data and making meaningful use of it.
Cleaning and organizing data can be time-consuming and even frustrating. But what if it didn’t have to be? Instead of spending hours fixing data issues manually, we can use Pandas—a powerful Python library—to automate the entire process. By automating the process, we not only save time but also reduce the chance of human error.
Let’s dive into how you can automate the data cleaning process with Pandas.
Basic Quality Checks
Before diving into cleaning the data, it’s good practice to first understand what’s wrong with it. Start by running a few basic checks that will give you an overview of the data's health. This step helps you identify missing values, outliers, or any inconsistencies.
# Load your CSV file
df = pd.read_csv('your_data.csv')

# Preview the data
print(df.head())

# Check for null values
print(df.isnull().sum())

# Get summary stats
print(df.describe(include='all'))
This gives you a quick preview of the data, helping you spot potential issues early on.
Standardize The Data
Sometimes, data comes in inconsistent formats. For example, dates might be in different formats, or numbers might be stored as strings. The goal here is to standardize the data into a format that’s easy to work with, especially for analysis or reporting.
For example, you can ensure that all your dates follow a uniform format (e.g., YYYY-MM-DD). This can also be done for numeric fields or categories.
# Convert a column to datetime

df['date_column'] = pd.to_datetime(df['date_column'], errors='coerce')


# Convert to numeric (float/int)

df['amount'] = pd.to_numeric(df['amount'], errors='coerce')


# Convert to category (for efficient memory use)

df['status'] = df['status'].astype('category')
Standardizing the data in this way makes it easier to work with and prevents errors during analysis.
Handle Missing Values and Duplicated Records
Missing values and duplicates are common issues in datasets. But don’t worry, Pandas has you covered. You can quickly drop rows with missing data or fill those missing values with a default value (like 0 for integers or 0.00 for decimals).
# Drop rows with any missing values

df_cleaned = df.dropna()


# Fill missing values with a constant or method

df['amount'].fillna(0, inplace=True)

df['category'].fillna(method='ffill', inplace=True)  # Forward fill
For more granular control, you can even handle different data types differently, like filling missing integers with 0 and decimals with 0.00:
# Replace missing integer values with 0 and decimal values with 0.00

types = df.dtypes

for col in df.columns:

    if types[col] == 'int64':

        df[col].fillna(0, inplace=True)

    elif types[col] == 'float64':

        df[col].fillna(0.00, inplace=True)
Reusable Data Cleaning Pipeline
Rather than manually cleaning each dataset, you can automate the entire process into a single function. This reusable pipeline will save you time and ensure consistent cleaning practices across all your datasets.
Here’s an example of how to automate the data cleaning process using a function:
import pandas as pd

from sqlalchemy import create_engine

import logging


# Setup logging

logging.basicConfig(level=logging.INFO, format='%(asctime)s - %(levelname)s - %(message)s')


def load_data(csv_file_path: str) -> pd.DataFrame:

    """Load CSV data into a DataFrame."""

    try:

        df = pd.read_csv(csv_file_path)

        logging.info(f"Data loaded from {csv_file_path}")

        return df

    except Exception as e:

        logging.error(f"Error loading data: {e}")

        raise


def standardize_data(df: pd.DataFrame) -> pd.DataFrame:

    """Standardize date, numeric, and categorical columns."""

    if 'date_column' in df.columns:

        df['date_column'] = pd.to_datetime(df['date_column'], errors='coerce')

    if 'amount' in df.columns:

        df['amount'] = pd.to_numeric(df['amount'], errors='coerce')

    if 'status' in df.columns:

        df['status'] = df['status'].astype('category')

    logging.info("Standardized data formats")

    return df


def handle_missing_values(df: pd.DataFrame) -> pd.DataFrame:

    """Fill missing numeric values with defaults."""

    for col in df.columns:

        dtype = df[col].dtype

        if pd.api.types.is_integer_dtype(dtype):

            df[col].fillna(0, inplace=True)

        elif pd.api.types.is_float_dtype(dtype):

            df[col].fillna(0.00, inplace=True)

    logging.info("Handled missing values")

    return df


def validate_data(df: pd.DataFrame) -> pd.DataFrame:

    """Validate DataFrame to ensure no missing values remain."""

    if df.isnull().sum().sum() > 0:

        logging.error("Validation failed: missing values present")

        raise ValueError("Validation failed")

    logging.info("Data validation passed")

    return df


def store_to_database(df: pd.DataFrame, db_connection_string: str, table_name: str) -> None:

    """Store DataFrame to SQL database."""

    try:

        engine = create_engine(db_connection_string)

        df.to_sql(table_name, con=engine, if_exists='replace', index=False)

        logging.info(f"Stored data in table: {table_name}")

    except Exception as e:

        logging.error(f"Error storing data: {e}")

        raise


def clean_data_pipeline(csv_file_path: str, db_connection_string: Optional[str] = None, table_name: Optional[str] = None) -> pd.DataFrame:

    """Run full cleaning pipeline on CSV data."""

    df = load_data(csv_file_path)

    df = standardize_data(df)

    df = handle_missing_values(df)

    df = validate_data(df)

    if db_connection_string and table_name:

        store_to_database(df, db_connection_string, table_name)

    return df
From Clean Data to Insight
Once you have a clean and structured dataset, it’s time to extract insights. Now that your data is ready for analysis, you can start answering real business questions.
For instance, you could want to know which product categories are driving the most revenue. With Pandas, you can easily group by product category and sum up the total sales.
# Group by product category and calculate total sales

category_insights = df.groupby('category')['total_sales'].sum().sort_values(ascending=False)

print(category_insights.head())
This gives you a clear, ranked view of which categories are performing best, helping you make smarter business decisions.
Another useful analysis might be understanding customer loyalty. For example, you can find how many customers have made repeat purchases:
# Count how many unique customers made more than one purchase

repeat_customers = df.groupby('customer_id')['order_id'].nunique()

repeat_count = (repeat_customers > 1).sum()

print(f"Number of repeat customers: {repeat_count}")
This quick aggregation helps you measure customer retention and loyalty, which are key for improving marketing and customer engagement strategies.
Conclusion
Pandas is an excellent tool to automate the process of transforming messy data into clean, meaningful formats ready for analysis. While data cleaning might not seem glamorous, it's a crucial step for any data-driven decision-making process.
By turning the cleaning steps into reusable functions, you save yourself hours of manual work and ensure the quality of your data. So the next time you encounter a messy CSV file -let your Pandas get to work!!

